Reading the daily tadalafil trial in percentage points
Follow the arithmetic behind a diary result: starting values, percentage-point changes, weighting, comparison groups and uncertainty.
Written by The ED Watch Editorial Board
Medical review pending · Source-based editorial draft
Drafted
Sources checked
A percentage printed beside a treatment name looks easy to interpret. The difficulty begins when it describes a change rather than an outcome. A starting percentage, a final percentage and the difference between them answer separate questions. Leaving out that distinction can turn a modest-looking change into an exaggerated promise, or make a useful result seem smaller than it is.
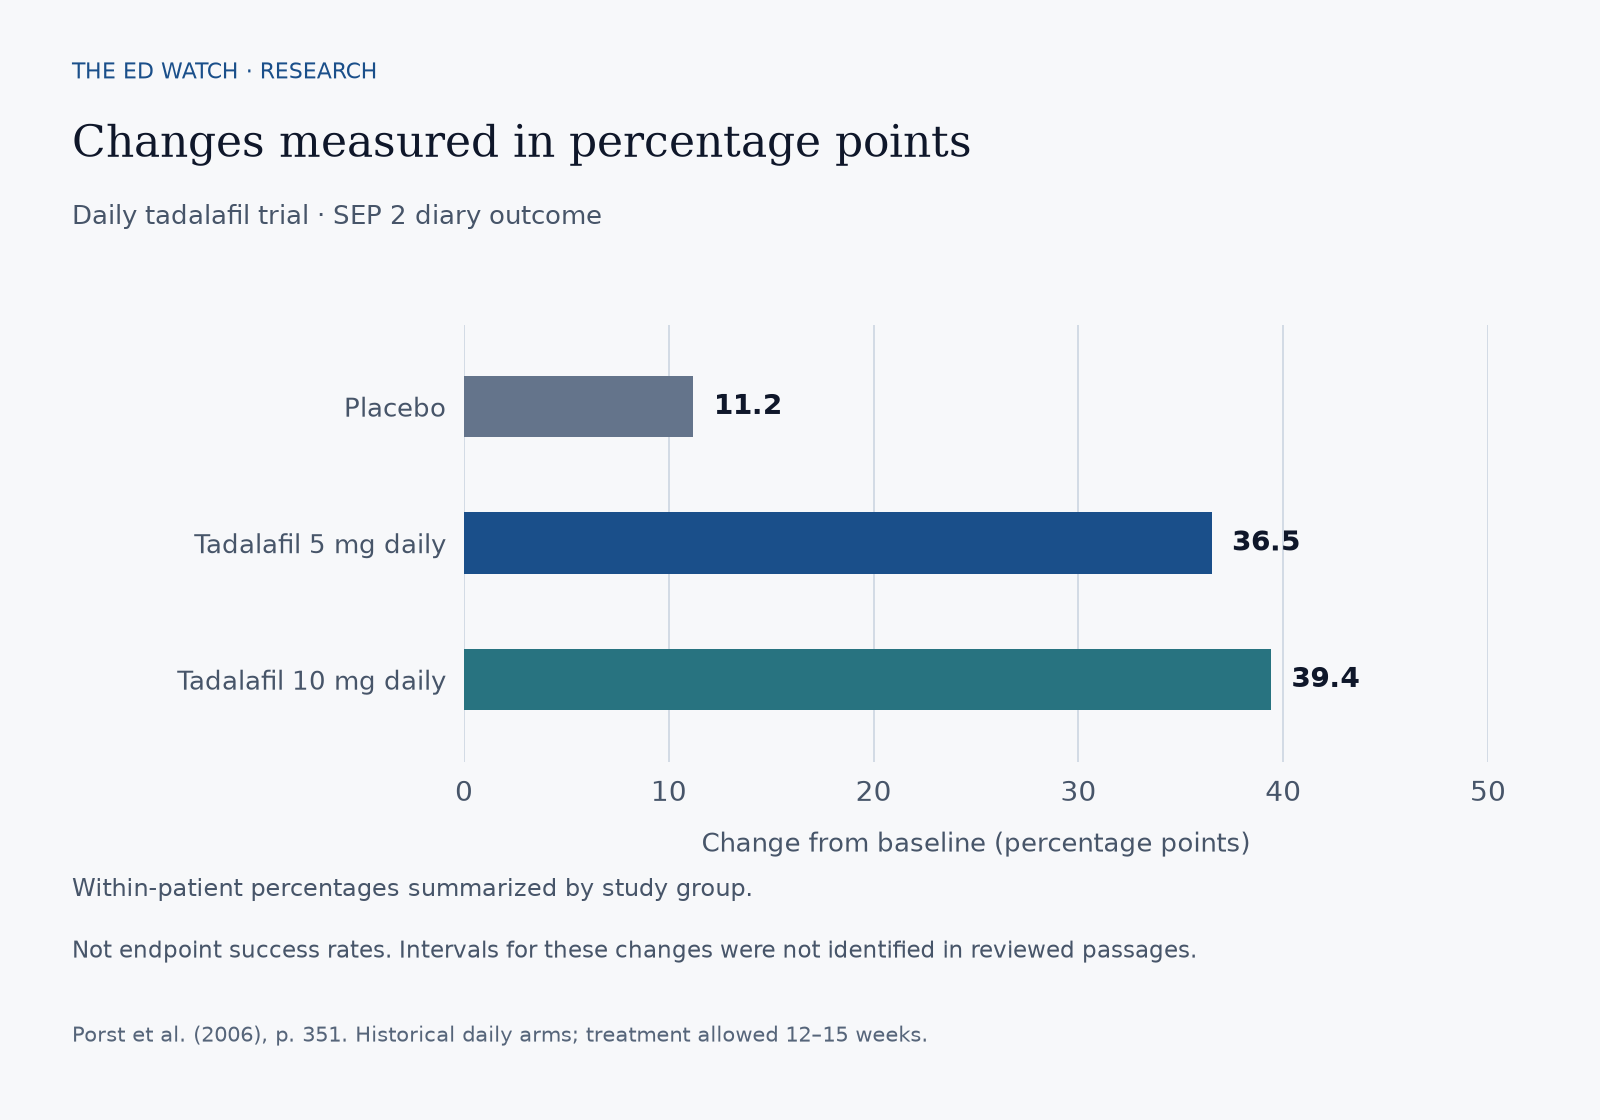
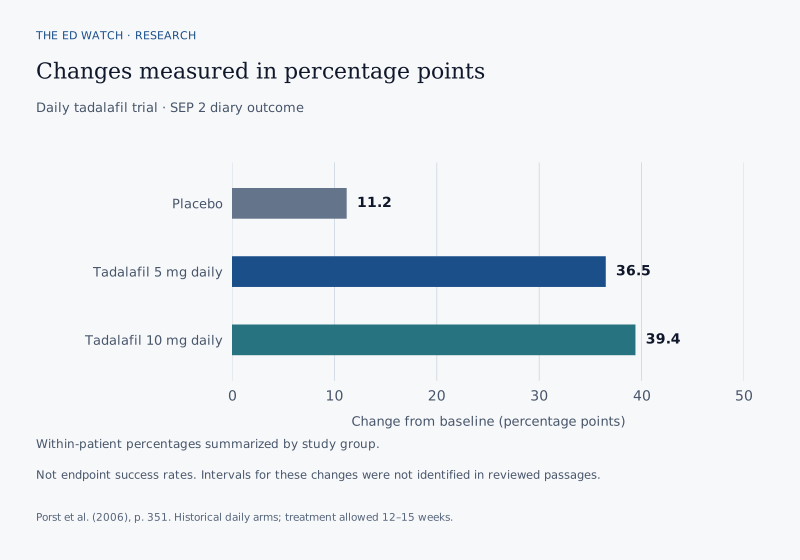
This analysis uses the daily tadalafil study as a setting for learning those distinctions. The accompanying chart carries the reported values. The examples below are original teaching examples, with invented numbers clearly identified; they do not reconstruct participant records or estimate anyone’s likely response. The aim is to make a research summary readable without asking it to answer a question its measurements never addressed.
Reading the evidence
- Name the quantity
- An endpoint percentage and a change in percentage points are different quantities. Keep the unit attached to every calculation.
Sources: Porst 2006
- Keep the starting value
- The same absolute change can lead to different final values. A change alone does not supply the missing baseline.
Sources: Porst 2006
- Notice the weighting
- Averaging people’s percentages and pooling all their attempts can produce different answers, even from the same invented records.
Sources: Porst 2006
- Separate magnitude from precision
- The size of an estimate does not reveal its uncertainty. A plotted bar is not a confidence interval.
Sources: Porst 2006
- Use current prescribing context
- Current CIALIS daily ED labeling concerns 2.5 mg and 5 mg. Historical research regimens are not personal prescribing instructions.
Sources: Cialis label
A change in a percentage has a different unit from a percentage at one time point.
Historical daily regimens; current routine daily ED labeling differs.
Sources: Porst 2006
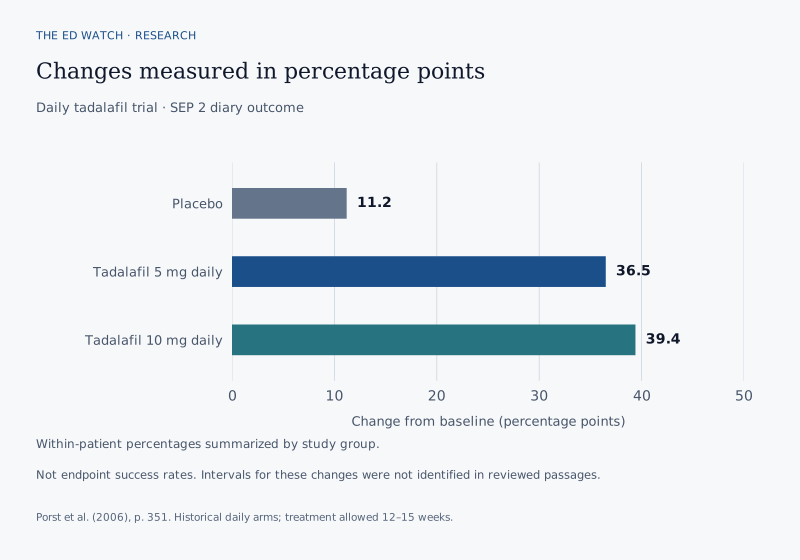
| Research group | Reported change | Unit |
|---|---|---|
| Placebo | 11.2 | Percentage points |
| Tadalafil 5 mg daily | 36.5 | Percentage points |
| Tadalafil 10 mg daily | 39.4 | Percentage points |
Start with the measurement, then read the result
Porst’s randomized trial compared placebo with daily oral tadalafil in men with ED. SEP2 measured penetration; reported changes used per-person percentages. The protocol allowed 12–15 treatment weeks. Historical arms used 5 or 10 mg. Nine participants withdrew for adverse events. Lilly ICOS funded the study, with Lilly/ICOS author affiliations and Lilly statistical and writing support.
For the numerical discussion, treat a study result as a labeled package. It needs an event definition, a denominator, a period and a rule for combining records. A bare number carries none of those instructions. Before comparing two values, write their labels in full. If the labels differ, the first job is to understand that difference, rather than immediately subtracting the numbers.
This reading method also keeps the result separate from the decision a reader eventually faces. A recorded event is one measurement, not a complete description of a person’s sexual experience or care needs. Our guide to reading ED reviews offers a broader framework for examining a claim. Here, the narrower task is to make each arithmetic step explicit and preserve the meaning of the underlying quantity.
Sources: Porst 2006
Subtract percentages; divide only when the question changes
Consider an invented example in which a percentage rises from 40% to 65%. The absolute change is 65 minus 40, or 25 percentage points. To calculate relative percentage change, divide that difference by the starting value: 25 divided by 40 equals 0.625, or 62.5%. Both calculations are correct, but they express different quantities. Neither calculation makes the endpoint itself a 65% improvement.
The denominator is what changes the interpretation. Absolute subtraction retains the original percentage scale. Relative change asks how large the increase was compared with the starting amount. Because that starting amount appears in the denominator, changing it changes the relative result. A headline that switches from one calculation to the other without naming the switch can create a false impression even when its arithmetic is accurate.
The table is an original teaching aid, not trial data. Read each row as a complete sentence: the label, calculation and unit belong together. When taking notes on research, copying all three is more useful than copying the most striking number. The discipline is simple, but it prevents a numerical comparison from silently becoming a different claim.
| Quantity | Calculation | Interpretation |
|---|---|---|
| Endpoint percentage | 65% | The final percentage in this invented example |
| Absolute change | 65 − 40 = 25 percentage points | Difference on the original percentage scale |
| Relative change | (65 − 40) ÷ 40 × 100 = 62.5% | Increase relative to the invented starting value |
Sources: Porst 2006
A matching change does not mean a matching endpoint
Now compare two invented trajectories: 40% to 65%, and 60% to 85%. Both increase by 25 percentage points. They do not finish at the same value. Turn the comparison around: 40% to 65% and 50% to 65% share a final value, but their changes are 25 and 15 percentage points. Change and endpoint contain overlapping information; neither can replace the other without knowing the baseline.
This is why a result described only as an increase leaves a practical question open. To recover an endpoint through addition, the baseline and change must refer to the same quantity and compatible records. You cannot fill the gap with a baseline from another population, time period or outcome merely because it appears elsewhere in the same paper. That would supply an assumption in place of the missing information.
For readers moving from research to treatment questions, keeping these distinctions visible is useful preparation. The daily versus as-needed tadalafil guide addresses a different question about regimens. An endpoint calculation does not by itself decide that question, and a regimen label does not explain the arithmetic of a reported change.
Sources: Porst 2006; Cialis label
A percentage has a ceiling, but people are not ceilings
A percentage constrained between zero and one hundred has limited mathematical room to rise. In an invented example starting at 90%, the largest possible absolute increase is 10 percentage points. A starting value of 30% leaves 70 points of room. These are properties of the scale, not predictions about what a treatment will do. Remaining room does not tell us how much of that room anyone will use.
This ceiling matters when comparing summaries. A small absolute increase near the top of a bounded scale and an equally small increase near the bottom need not carry the same descriptive meaning. Yet the ceiling alone cannot identify which change matters more to a person. That requires a defined interpretation of the outcome and information beyond the numerical limit. Arithmetic can locate the boundary; it cannot supply that judgment.
The same care applies at the lower boundary. A relative increase is undefined when its starting denominator is zero, even though an absolute change may still be calculable. A very small nonzero baseline can also produce a large relative percentage. Keeping the absolute values alongside the relative calculation makes that behavior visible instead of treating a large ratio as a self-explanatory finding.
Sources: Porst 2006
Averaging people and pooling attempts ask different questions
Imagine two fictional diary records. Person A records one successful event in two attempts, giving 50%. Person B records nine in ten, giving 90%. Giving each person equal weight produces an average of 70%. Pooling their attempts instead produces ten successful events out of twelve, about 83.3%. The records have not changed. The rule for combining them has.
In the equal-person calculation, each individual contributes half of the final summary. In the pooled calculation, the person with more recorded attempts contributes more observations. Neither arithmetic rule is inherently dishonest. The important question is which quantity the analysis intends to estimate. A reader should not substitute one rule for another because the substituted result seems more intuitive or more impressive.
These invented records also show why an average percentage does not uniquely reveal the underlying counts. Many combinations could produce the same summary. Recovering a total number of events would require the relevant denominators and aggregation method. Our companion analysis of sildenafil scores and standard errors explores another version of this information loss: how a score average can conceal different individual distributions. The measurements should be understood separately, without turning the two papers into a drug ranking.
Sources: Porst 2006; Goldstein 1998
Within-group movement is different from a comparator contrast
Suppose, in another invented example, an intervention group increases by 18 percentage points and a comparison group increases by 6. The difference between those changes is 12 percentage points. Three numbers now describe three different things: movement within the intervention group, movement within the comparison group, and the difference in movement. Calling all three the treatment effect would erase their distinct meanings.
Even this simple difference is only the arithmetic contrast specified by the example. An actual study may use an adjusted model, particular analysis records or other prespecified procedures. Subtracting two rounded values from a display does not necessarily reproduce that analysis. The comparison should be read from the reported method and estimate, rather than reconstructed from whichever numbers happen to be easiest to find.
A useful annotation is to write “compared with what?” beside every claim of improvement. If the answer is the same group’s earlier value, label it as change over time. If the answer is another group, identify that group and the type of contrast. Doing so leaves room for a meaningful result while preventing a descriptive change from carrying an inference that belongs to a separate analysis.
Sources: Porst 2006
Check that the numbers belong together before combining them
Addition and subtraction require compatible inputs. Imagine a report that gives a baseline for everyone enrolled but an endpoint for people with available follow-up. The two displayed averages could describe different sets of records. Their difference is still a mathematical subtraction, but it does not automatically become the average within-person change. This hypothetical example identifies a question to investigate, not a claim about missing records in the tadalafil trial.
Compatibility also concerns timing and adjustment. A value calculated over one window cannot simply stand in for another window. A model-adjusted estimate and a raw observed average may not be interchangeable. Before attempting a reconstruction, check whether the definitions match. If the necessary information is unavailable, leaving the calculation unfinished is more accurate than presenting a precise result built on an unstated assumption.
The worksheet below is an original reading tool. Its purpose is to make the required matching conditions visible. It does not imply that every possible problem occurred. A careful reader can use it to distinguish a verified calculation from a question that still needs the methods, supplementary material or underlying records. Precision in the written answer begins with precision about which inputs were actually available.
| Proposed calculation | What must match | Possible mistake |
|---|---|---|
| Endpoint minus baseline | Outcome definition, compatible analysis records and time windows | Calling a difference between unmatched summaries a within-person change |
| One group minus another | Unit, comparison period and intended statistical contrast | Mixing an adjusted estimate with a raw summary |
| Recovering an endpoint from a change | The baseline must belong to that exact change definition | Importing a convenient baseline from another analysis |
Sources: Porst 2006
Magnitude does not tell us how precise the estimate is
A bar can show the size of an estimate without showing how uncertain that estimate is. A longer bar is not automatically a more precise result. Conversely, a short interval around an estimate would describe precision under a particular statistical method; it would not by itself establish that the change is personally important. Magnitude, uncertainty and practical meaning are separate questions.
For this chart, uncertainty information for the exact displayed changes is not available in the inspected passages. Adding invented error bars would make the graphic look more complete while making it less faithful to the evidence. This access limit does not demonstrate certainty, and it does not demonstrate absence of an effect. It identifies a part of the numerical account that this analysis cannot display.
Reading benefit estimates also leaves a separate safety assessment to make. A clear numerical endpoint does not summarize every possible unwanted outcome. The guide to managing PDE5 side effects is a related starting point for understanding that separate topic. The important reasoning habit is to avoid letting the visual strength of one result substitute for an evaluation of the other information relevant to care.
Sources: Porst 2006; Cialis label
A missing entry is not an observed answer
Imagine a fictional diary with three completed yes-or-no entries and a fourth blank entry. The blank does not tell us whether an event succeeded, failed or was never attempted. Assigning it a value would require a rule and an explanation. Different rules can answer different analytical questions. This example illustrates a measurement problem; it does not assert that these specific records existed in the study.
A separate questionnaire creates another distinction. Carrying an earlier questionnaire score forward would be a rule about that score. It would not, by itself, define what to do with an unrecorded diary event. The reader therefore needs an outcome-specific account of missing-data handling. It is unsafe to assume that a procedure mentioned for one measurement applies automatically to every other measurement in a report.
Missing information in research and missing information in a clinical consultation also call for different responses. Statistical rules cannot replace a personal assessment. Our ED and heart health guide discusses another part of that clinical context. The original reasoning here is narrower: identify what was recorded, what was left unknown and which assumptions enter when an analysis moves from those records to a summary.
Sources: Porst 2006; Cialis label
Keep historical research separate from current care
Current CIALIS labeling contraindicates use with nitrates and guanylate cyclase stimulators such as riociguat. It calls for medical assessment, including cardiovascular status and interacting medicines. An erection lasting over four hours needs emergency care; sudden vision loss or sudden hearing decrease or loss requires stopping the medicine and prompt medical attention. These label warnings are distinct from the trial’s numerical endpoint. They do not supply an individual regimen.
The tadalafil medication review provides a separate place to examine product information. A research estimate also needs to remain attached to the formulation and intervention actually studied. FDA explains that compounded drugs are not FDA-approved and do not undergo its premarket review for safety, effectiveness or quality. Our compounded ED products guide addresses that separate evidence boundary.
Finally, service selection adds documentary questions that a trial cannot answer. As an editorial reading exercise, use the CoreAge Rx provider review to inspect stated service terms and what documentation supports them. That link does not establish that a provider offers the studied regimen or reproduces the study’s outcomes. Keep three decisions distinct: interpreting the measurement, evaluating current medical suitability and examining a service’s terms. Good arithmetic helps with the first; it cannot settle the other two by itself.
Sources: Cialis label; FDA compounding guidance
Questions about the evidence
Can a change tell me the final percentage if the baseline is omitted?
Only if the missing baseline can be established for that exact change definition. Adding a convenient starting value from a different group or analysis would introduce an assumption. In the original examples here, the baseline is explicitly supplied, so the addition is transparent. That is different from recovering an unreported study value.
Sources: Porst 2006
Why does relative change look larger than percentage-point change?
Relative change divides by the starting value; percentage-point change simply subtracts percentages. The numbers therefore use different scales. A larger relative figure is not an extra improvement on top of the absolute change. Write the calculation and its unit beside the result before comparing it with another figure.
Sources: Porst 2006
Can I work backward from an average to the number of successful attempts?
An average does not usually identify a unique set of underlying records. You would need the relevant counts, denominators and weighting rule. The fictional two-person example shows how the same records can yield different summaries, depending on whether people or attempts receive equal weight. Neither summary alone reconstructs the full diary.
Sources: Porst 2006
Would error bars make the chart more informative?
They would add useful information only if they represented a documented uncertainty measure for the displayed estimate. Borrowing an interval from another outcome or creating one without the necessary information would mislead. A graphic should expose what is known and identify what is unavailable, rather than use visual detail to suggest unsupported precision.
Sources: Porst 2006
Does a clearly interpreted result establish the best option for me?
No. A sound interpretation identifies the research question and the measurement behind its answer. Personal suitability requires a clinical assessment; product and service claims need their own documentation. Treat those as additional questions, not as gaps that can be filled by choosing the largest plotted number.
Sources: Porst 2006; Cialis label; FDA compounding guidance
Editorial assessment
The useful reading habit is to preserve the entire numerical sentence: what was measured, how records were combined, where the comparison begins and which unit describes the change. The invented examples show that even correct arithmetic can answer the wrong question when one of those details is exchanged unnoticed. For a reader assessing evidence, an explicit limitation is information. It marks where the available result ends and where an additional source, a different analysis or a clinical conversation is needed. That is a more durable conclusion than turning any single change into a personal success rate.
Sources and access
- Oral sildenafil in the treatment of erectile dysfunction. Sildenafil Study Group.
Relevant methods, results and funding passages inspected in a retained full-text primary article.
Checked 2026-10-25.
- Evaluation of the efficacy and safety of once-a-day dosing of tadalafil 5mg and 10mg in the treatment of erectile dysfunction: results of a multicenter, randomized, double-blind, placebo-controlled trial.
Relevant methods, results and funding passages inspected in a retained full-text primary article.
Checked 2026-10-25.
- VIAGRA (sildenafil citrate) US prescribing information
Current official prescribing information inspected.
Checked 2026-10-25.
- Cialis (tadalafil) prescribing information
Current official prescribing information inspected.
Checked 2026-10-25.
- Understanding the risks of compounded drugs
Official FDA guidance inspected.
Checked 2026-10-25.