Sildenafil frequency scores and the meaning of standard errors
A close reading of score averages, uncertainty bars and the questions an individual treatment decision still needs answered.
Written by The ED Watch Editorial Board
Medical review pending · Source-based editorial draft
Drafted
Sources checked
A point on a research chart can look reassuringly precise. It has a position, perhaps an error bar, and a label identifying a treatment group. Yet its meaning depends on a sequence of decisions: what was recorded, how responses were coded, which records entered the calculation and what kind of uncertainty the bar represents. Reading those decisions is more useful than treating the tallest point as a personal forecast.
This analysis uses sildenafil research to explore that sequence. The original numerical results appear in the accompanying figure and data table. The examples below are deliberately invented teaching exercises, clearly separated from the clinical observations. They explain why an average, a probability and a measure of precision are different objects, even when a chart places them close together. Our aim is to make the units and assumptions visible before drawing a conclusion.
Reading the evidence
- Name the quantity
- A score average describes coded responses; it is not automatically a probability of success.
Sources: Goldstein 1998
- Separate spread from precision
- Variation among observations and uncertainty of an estimated mean answer different questions.
Sources: Goldstein 1998
- Read the interval label
- An uncertainty bar needs a stated definition before its width can be interpreted.
Sources: Goldstein 1998
- Keep the comparison intact
- A descriptive difference should not stand in for a specified statistical test.
Sources: Goldstein 1998
- Leave prescribing to an assessment
- A research chart cannot determine an individual prescription or establish the suitability of a different formulation.
Sources: Viagra label; FDA compounding guidance
Group means and their standard errors answer different questions from a personal success percentage.
Historical research arms; no individual dosing advice.
Sources: Goldstein 1998
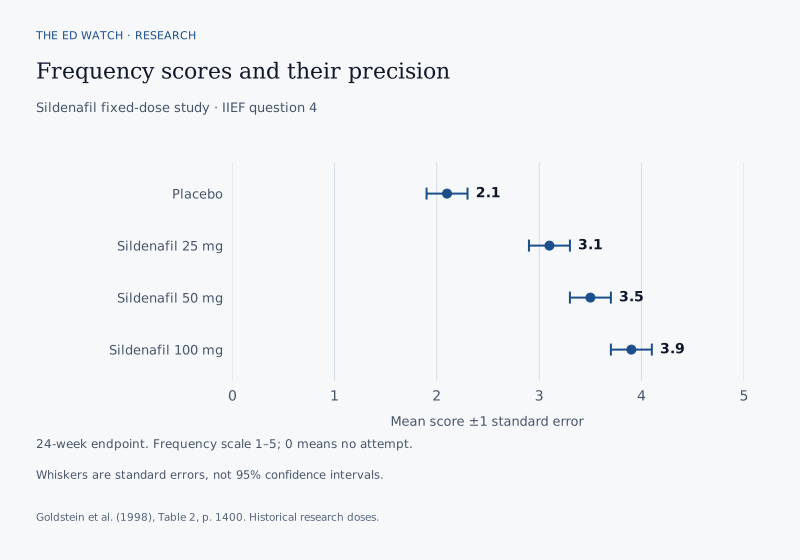
| Research group | Mean ±SE | Analysis n |
|---|---|---|
| Placebo | 2.1±0.2 | 199 |
| Sildenafil 25 mg | 3.1±0.2 | 96 |
| Sildenafil 50 mg | 3.5±0.2 | 105 |
| Sildenafil 100 mg | 3.9±0.2 | 101 |
Identify the question before reading the point
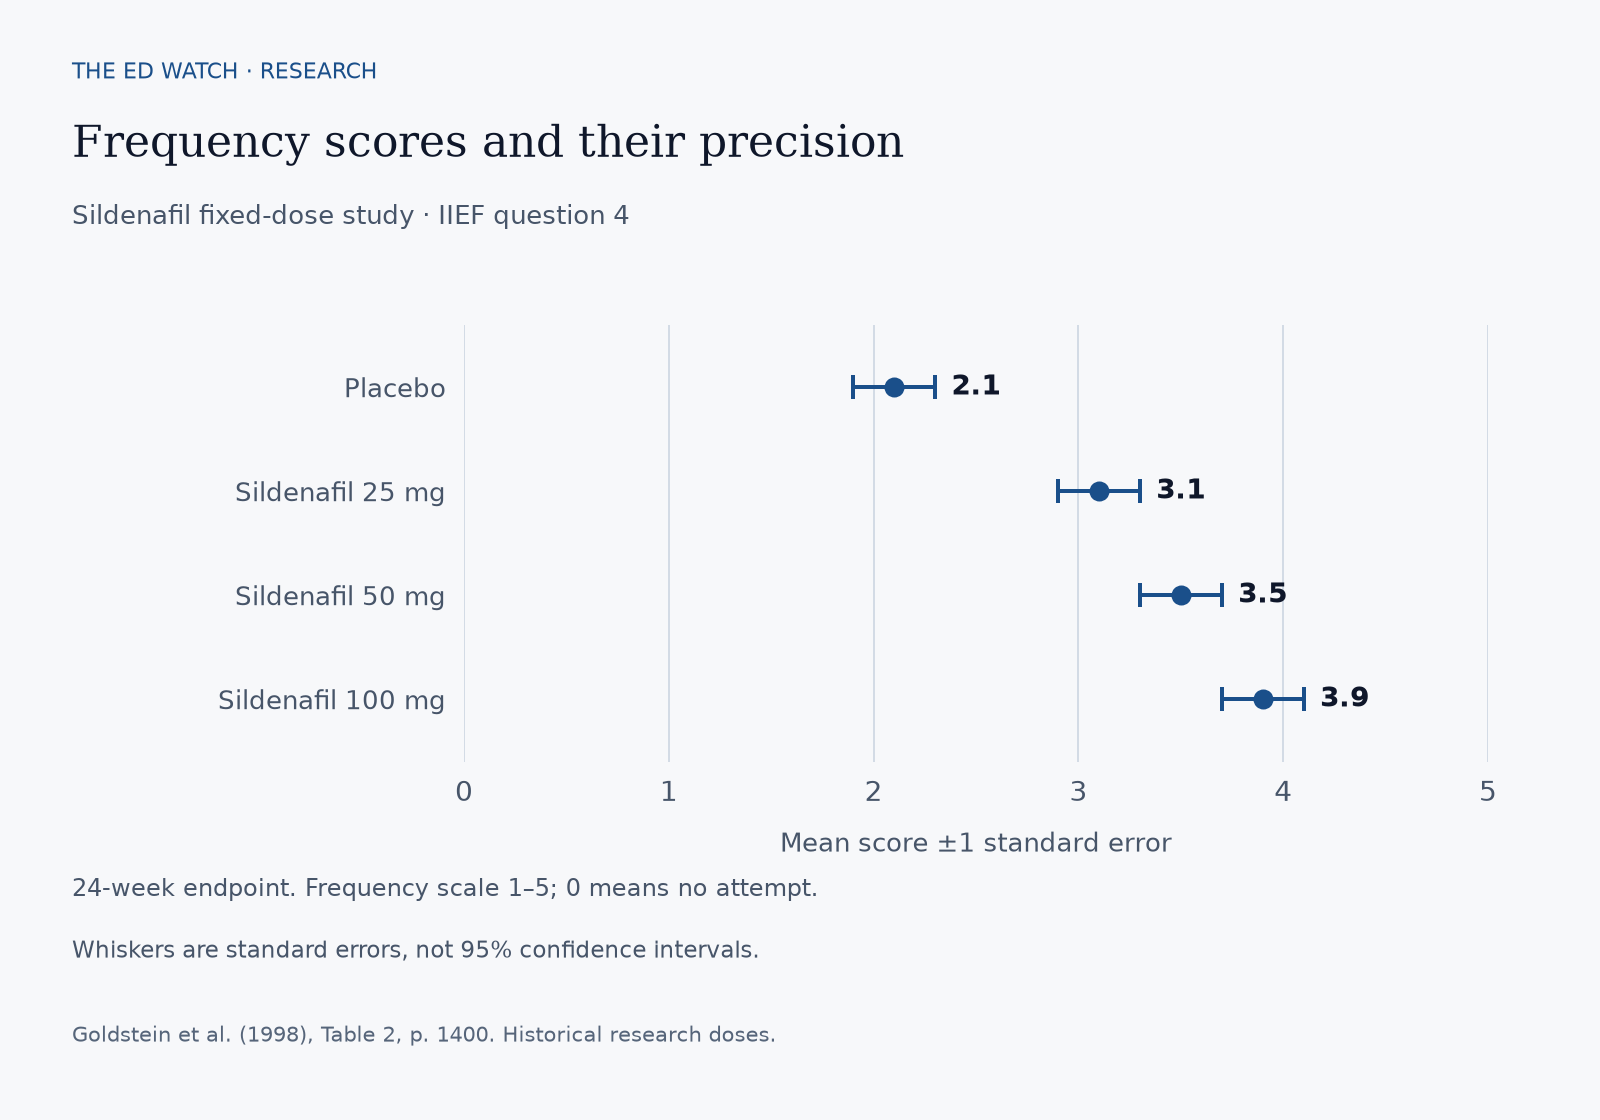
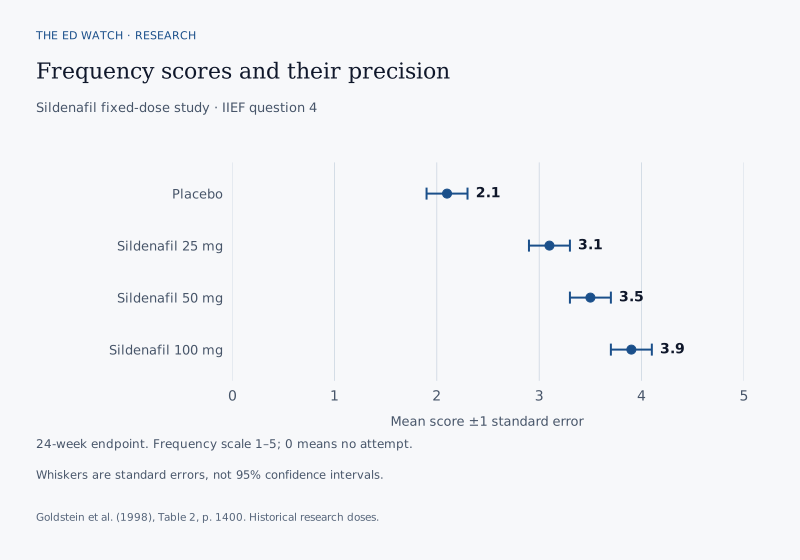
Goldstein’s placebo-controlled, 24-week fixed-dose oral sildenafil study in men with ED measured erection-maintenance frequency with Q4: 1–5, with 0 for no attempt. Pfizer funded the research; authors reported consulting and company affiliations. Headache, flushing and dyspepsia were common in its separate flexible-dose study.
That compact description sets the frame for the figure. Our interpretation begins by identifying a question, its response system and the period being summarized. A calculation can be correct while answering the wrong question. A reader interested in satisfaction, for example, should not silently substitute a measure of frequency and assume the two experiences are interchangeable. The chart’s title and axis are part of the result, not decorative information.
A useful reading habit is to write a plain sentence beginning: this point summarizes. Complete the sentence without using the vague word effectiveness. If the result is an average score, name the score. If a count appears beside it, ask what records that count describes before using it as a denominator. Our guide to reading ED reviews provides another place to practice separating a claim from the evidence needed to support it.
Sources: Goldstein 1998
The same average can conceal different patterns
Consider two invented groups rating an ordinary service on an arbitrary scale. Group A records 2, 2, 4 and 4; group B records 1, 3, 3 and 5. Both sums are twelve, and each group contains four observations, so both averages are three. These are not clinical records or reconstructed questionnaire responses. The exercise isolates a mathematical feature of averaging: different collections can produce the same summary.
A mean preserves the total relative to the number of observations. It does not preserve their arrangement or reveal how many sit at either end. Someone looking only at the average cannot tell which invented group contains the lowest and highest ratings. Nor can they recover each person’s experience by distributing the average back across the group. That missing detail has been compressed away.
This does not make an average useless. It defines its job. A summary can help compare groups while leaving distributional questions open. When reading a clinical figure, ask whether the claim being made needs the average alone or also needs information about individual responses. If it needs both, an attractive mean should not be allowed to supply the missing half.
| Teaching group | Arbitrary ratings | Calculation |
|---|---|---|
| A | 2, 2, 4, 4 | 12 ÷ 4 = 3 |
| B | 1, 3, 3, 5 | 12 ÷ 4 = 3 |
Sources: Goldstein 1998
Dividing by the maximum does not create a success rate
Suppose a separate, invented satisfaction scale runs from one to five and has a mean of four. Dividing four by five gives 0.8. The arithmetic is valid, but calling that result an eighty-percent success rate adds a definition that the calculation never contained. No yes-or-no success event has been specified, and no count of successful people has been divided by a count of eligible people.
Changing the numerical labels exposes the problem. Imagine relabeling the same ordered categories from zero through four. Their order and the underlying responses remain unchanged, but a mean expressed relative to the new maximum changes. A genuine proportion of people satisfying a fixed rule would not change merely because category labels were renumbered. The shortcut is sensitive to the coding, not just the experiences being described.
A probability claim therefore needs its own event definition and denominator. A score may be informative without becoming a proportion. Our daily tadalafil analysis examines another unit problem: distinguishing a percentage from a change in that percentage. Reading the two articles together is an exercise in measurement, not a comparison establishing which medicine works better.
Sources: Goldstein 1998; Porst 2006
Distinguish a recorded answer from an absent record
Imagine a hypothetical survey about visits to a public library. A form could record no visit, a visit with a low satisfaction rating, or a blank answer. Those three entries convey different information. The first describes whether an opportunity occurred, the second evaluates an experience, and the third leaves the reason unknown. Treating them as interchangeable would change the question being answered by the resulting average.
Before doing arithmetic, a researcher must define how each entry is represented and which records belong in the calculation. The reader’s task is to locate that definition rather than invent one. A blank could reflect many circumstances, but a summary table cannot tell us which explanation applies to a particular absent record. Speculation about motivation does not repair missing measurement information.
This distinction also matters when someone compares a questionnaire summary with their own account. The description of what happened and the circumstances in which it happened may need separate discussion. Our guide to sildenafil that seems not to work is a related reading route; it should not be used to assign a reason to an unobserved trial record or to reconstruct a person’s response from a group result.
Sources: Goldstein 1998; Viagra label
Standard deviation and standard error have different jobs
Standard deviation describes how spread out observations are around their mean. Standard error describes uncertainty in an estimate such as that mean under a statistical model. The abbreviations look similar, but replacing one with the other changes the story. A narrow estimate of a group average does not require every observation in that group to be close to it.
For a deliberately simplified, hypothetical set of independent continuous measurements, use the familiar sample-mean formula: standard error equals standard deviation divided by the square root of the sample size. With a standard deviation of two and twenty-five observations, the calculation gives 0.4. With the same spread and one hundred observations, it gives 0.2. The individual spread was held fixed while the estimated average became more precise.
These are teaching calculations, not a recomputation of the sildenafil results. Their assumptions and invented measurements are separate from the clinical analysis. They show why a small standard error should not be described as the range of individual experiences. When a chart legend identifies a precision measure, retain that label in your notes rather than replacing it with the looser phrase variation in response.
Sources: Goldstein 1998
One standard error is not a ninety-five-percent interval
An error bar is a graphical container; its label tells you what the container holds. A bar extending one standard error on either side of a mean is not automatically a ninety-five-percent confidence interval. Attaching a familiar confidence level without specifying the method would create information that the drawing does not provide.
A confidence interval requires an explicit inferential procedure, including assumptions about the estimate and how uncertainty is calculated. The interpretation belongs to that procedure. It should not be borrowed from a different graph because both happen to have horizontal whiskers. Likewise, a confidence interval for a group mean would not be a range expected to contain the same percentage of individual responses. Those are different statistical targets.
A practical approach is to copy the bar’s exact definition before comparing its width with another one. If the definition is unavailable, leave the confidence level unresolved. If it is available, preserve it. This analysis does not manufacture clinical confidence limits from the plotted values. An honest description of what has been reported is more informative than a more elaborate-looking figure built from unstated assumptions.
Sources: Goldstein 1998
Precision of an average does not identify a person
Imagine knowing the average height of a large group with very little uncertainty. That knowledge would still not identify the height of the next person entering the room. The precision of the group estimate and the range of individuals are separate questions. The same logical distinction applies when a summary is offered as if it were a forecast about one reader.
A personal prediction would require an additional model and evidence showing how it performs for that purpose. Simply attaching an individual’s name to a group mean does not create such a model. A reader should ask what outcome is being predicted, over what period, and how the prediction was checked. These questions concern the claim’s structure; they do not assume that a prediction tool exists for the chart in front of us.
The table below separates several common questions from shortcuts that would answer something else. It is an editorial worksheet, not a list of findings from study participants. Our sildenafil medication review provides a separate route into the medicine’s context. Keep that review and the statistical figure in their respective roles rather than making one number carry every part of a decision.
| Question | Evidence needed | Shortcut to avoid |
|---|---|---|
| Where is the group average? | A defined measure, analysis group and mean | Treating the mean as everyone’s result |
| How variable are individuals? | A distribution or appropriate spread summary | Calling the standard error an individual range |
| What happens for one person? | A prediction method assessed for that purpose | Assigning the group average to that person |
Sources: Goldstein 1998; Viagra label
An endpoint gap is not an adjusted treatment test
Use another invented example: group A moves from an average rating of two to four, while group B moves from one to three. Their endpoint means differ by one, but both groups have increased by two. The final difference and the difference between changes answer different questions. Neither calculation, by itself, tells us how a specified adjusted statistical analysis would treat these observations.
These arbitrary ratings are not the study’s baseline or endpoint values. Their purpose is to show why a reader should preserve the comparison used by an analysis. An adjusted model may require baseline measurements, other variables, a defined analysis population and decisions about uncertainty. Reproducing that model needs more than the rounded values visible in a figure. A neat subtraction cannot stand in for absent records and model specifications.
Nor should the overlap or separation of uncertainty bars be treated as a universal test of a treatment difference. The relevant question is what comparison was specified and how it was evaluated. Our sildenafil and tadalafil comparison guide is useful adjacent reading, but separate charts from separate studies do not become a randomized comparison merely because they can be placed side by side.
Sources: Goldstein 1998; Porst 2006
Decide what would make a change meaningful
Statistical precision and personal importance are different dimensions. A reader may care about an experience that the reported measure only partly describes. Before interpreting a number as meaningful, identify the outcome of interest, the instrument used to record it and the standard by which a change would be judged. This article does not invent a clinical threshold for an improvement that matters to every person.
An assessment could distinguish a change in recorded frequency from a change in confidence, convenience or satisfaction. That distinction is conceptual, not a claim that these studies measured every item on that list. Adding more personally relevant questions does not erase the original result; it prevents the result from being asked to answer questions it was not designed to settle.
The same discipline applies when the decision involves a service. Our Ro provider review can be used to inspect documented terms separately. A trial estimate supplies no evidence about that provider’s administrative performance or an individual’s experience with it. Write down the clinical question and the service question as separate lines. Each then has a visible evidence requirement, instead of borrowing reassurance from the other.
Sources: Goldstein 1998; Viagra label
Keep current safety and formulation evidence separate
Current Viagra labeling contraindicates nitrates and guanylate cyclase stimulators such as riociguat, and calls for assessment of underlying causes and cardiovascular status. An erection lasting over four hours requires immediate medical care. Sudden vision loss or a sudden hearing decrease or loss requires stopping use and obtaining medical attention promptly. Other medicines and health conditions belong in the prescribing assessment.
Those warnings come from prescribing information, not from the size of a statistical error bar. A precise efficacy estimate cannot cancel an interaction or establish personal suitability. Our guide to managing PDE5 side effects is additional background for understanding the questions to raise with a clinician. The historical group labels in a research figure are descriptions of study arms, not a schedule to copy or a dose to select.
FDA states that compounded medicines are not FDA-approved and do not undergo its premarket review for safety, effectiveness or quality. Our compounded ED products guide considers that separate evidence boundary. The editorial implication is narrow: findings about a studied product do not, by themselves, validate a different formulation or combination. A shared ingredient name does not complete the missing comparison.
Sources: Viagra label; FDA compounding guidance
Questions about the evidence
Can two groups have the same mean and different proportions above a cutoff?
Yes. A mean does not preserve the full distribution. Once a cutoff is defined, counting observations above it is a separate operation. The invented rating examples illustrate that information can be lost when several observations are compressed into one average. A cutoff should not be invented after seeing the mean and then described as a reported clinical result.
Sources: Goldstein 1998
Does a smaller standard error prove that a treatment has a larger effect?
No. Precision and magnitude are different properties of an estimate. A small standard error can accompany an estimate close to a comparator or far from it. Assessing a treatment comparison requires its specified effect measure and analysis; the width of one group’s uncertainty bar is not a substitute.
Sources: Goldstein 1998
Should I use the upper end of an error bar as an optimistic personal forecast?
No. An uncertainty interval about a group estimate is not a menu of individual outcomes. Selecting its upper end adds a personal interpretation that the interval was not constructed to support. Keep the statistical target attached to the number rather than turning a graphical endpoint into an expectation.
Sources: Goldstein 1998
Can rounded published values reproduce the original analysis?
Not necessarily. Rounding removes numerical detail, and an adjusted analysis may use information absent from the summary. Even correct arithmetic on the displayed numbers may answer a different question. State a calculation as a descriptive exercise when that is all it is; do not label it a reproduction of the original statistical test.
Sources: Goldstein 1998
Why include a separate prescribing-information source in a statistical article?
The sources serve different purposes. Research helps interpret a measured result; current prescribing information addresses clinical use and safety. A sound reading keeps those roles visible. Understanding an average can improve a conversation about evidence, but it does not turn an educational chart into an individual treatment assessment.
Sources: Viagra label
Editorial assessment
Our reading rule is to keep each quantity attached to its question. Name the response, identify the summary, preserve the uncertainty label and locate the intended comparison. Then distinguish the group result from the evidence needed for an individual decision. The original worked examples show how an accurate calculation can still support an inaccurate interpretation when units or targets are silently changed. A clear research summary should leave the reader better able to inspect those transitions. It should not make an error bar, a dose label or a provider name appear to supply information that was never measured.
Sources and access
- Oral sildenafil in the treatment of erectile dysfunction. Sildenafil Study Group.
Relevant methods, results and funding passages inspected in a retained full-text primary article.
Checked 2026-10-25.
- Evaluation of the efficacy and safety of once-a-day dosing of tadalafil 5mg and 10mg in the treatment of erectile dysfunction: results of a multicenter, randomized, double-blind, placebo-controlled trial.
Relevant methods, results and funding passages inspected in a retained full-text primary article.
Checked 2026-10-25.
- VIAGRA (sildenafil citrate) US prescribing information
Current official prescribing information inspected.
Checked 2026-10-25.
- Cialis (tadalafil) prescribing information
Current official prescribing information inspected.
Checked 2026-10-25.
- Understanding the risks of compounded drugs
Official FDA guidance inspected.
Checked 2026-10-25.